Clear status. Contextual action.
Modernizing an outdated surety experience through reusable navigation, forms, approvals, and table patterns. A closer look at the Progress Reports prototypes.
A legacy platform that needed a clearer path.
Tinubu’s existing surety platform was developer-built and had grown without a design-thinking process. It was outdated, slow, and difficult to navigate. The opportunity was to bring user tasks and product-wide design decisions into focus, unify the experience, and make everyday work feel faster and more dynamic.
My work connected design-system development with navigation, forms, approvals, and data-table patterns for brokers and underwriters. I progressed from Senior to Lead Product Designer, combining hands-on design with team practices and engineering collaboration.
Make the next operational step visible.
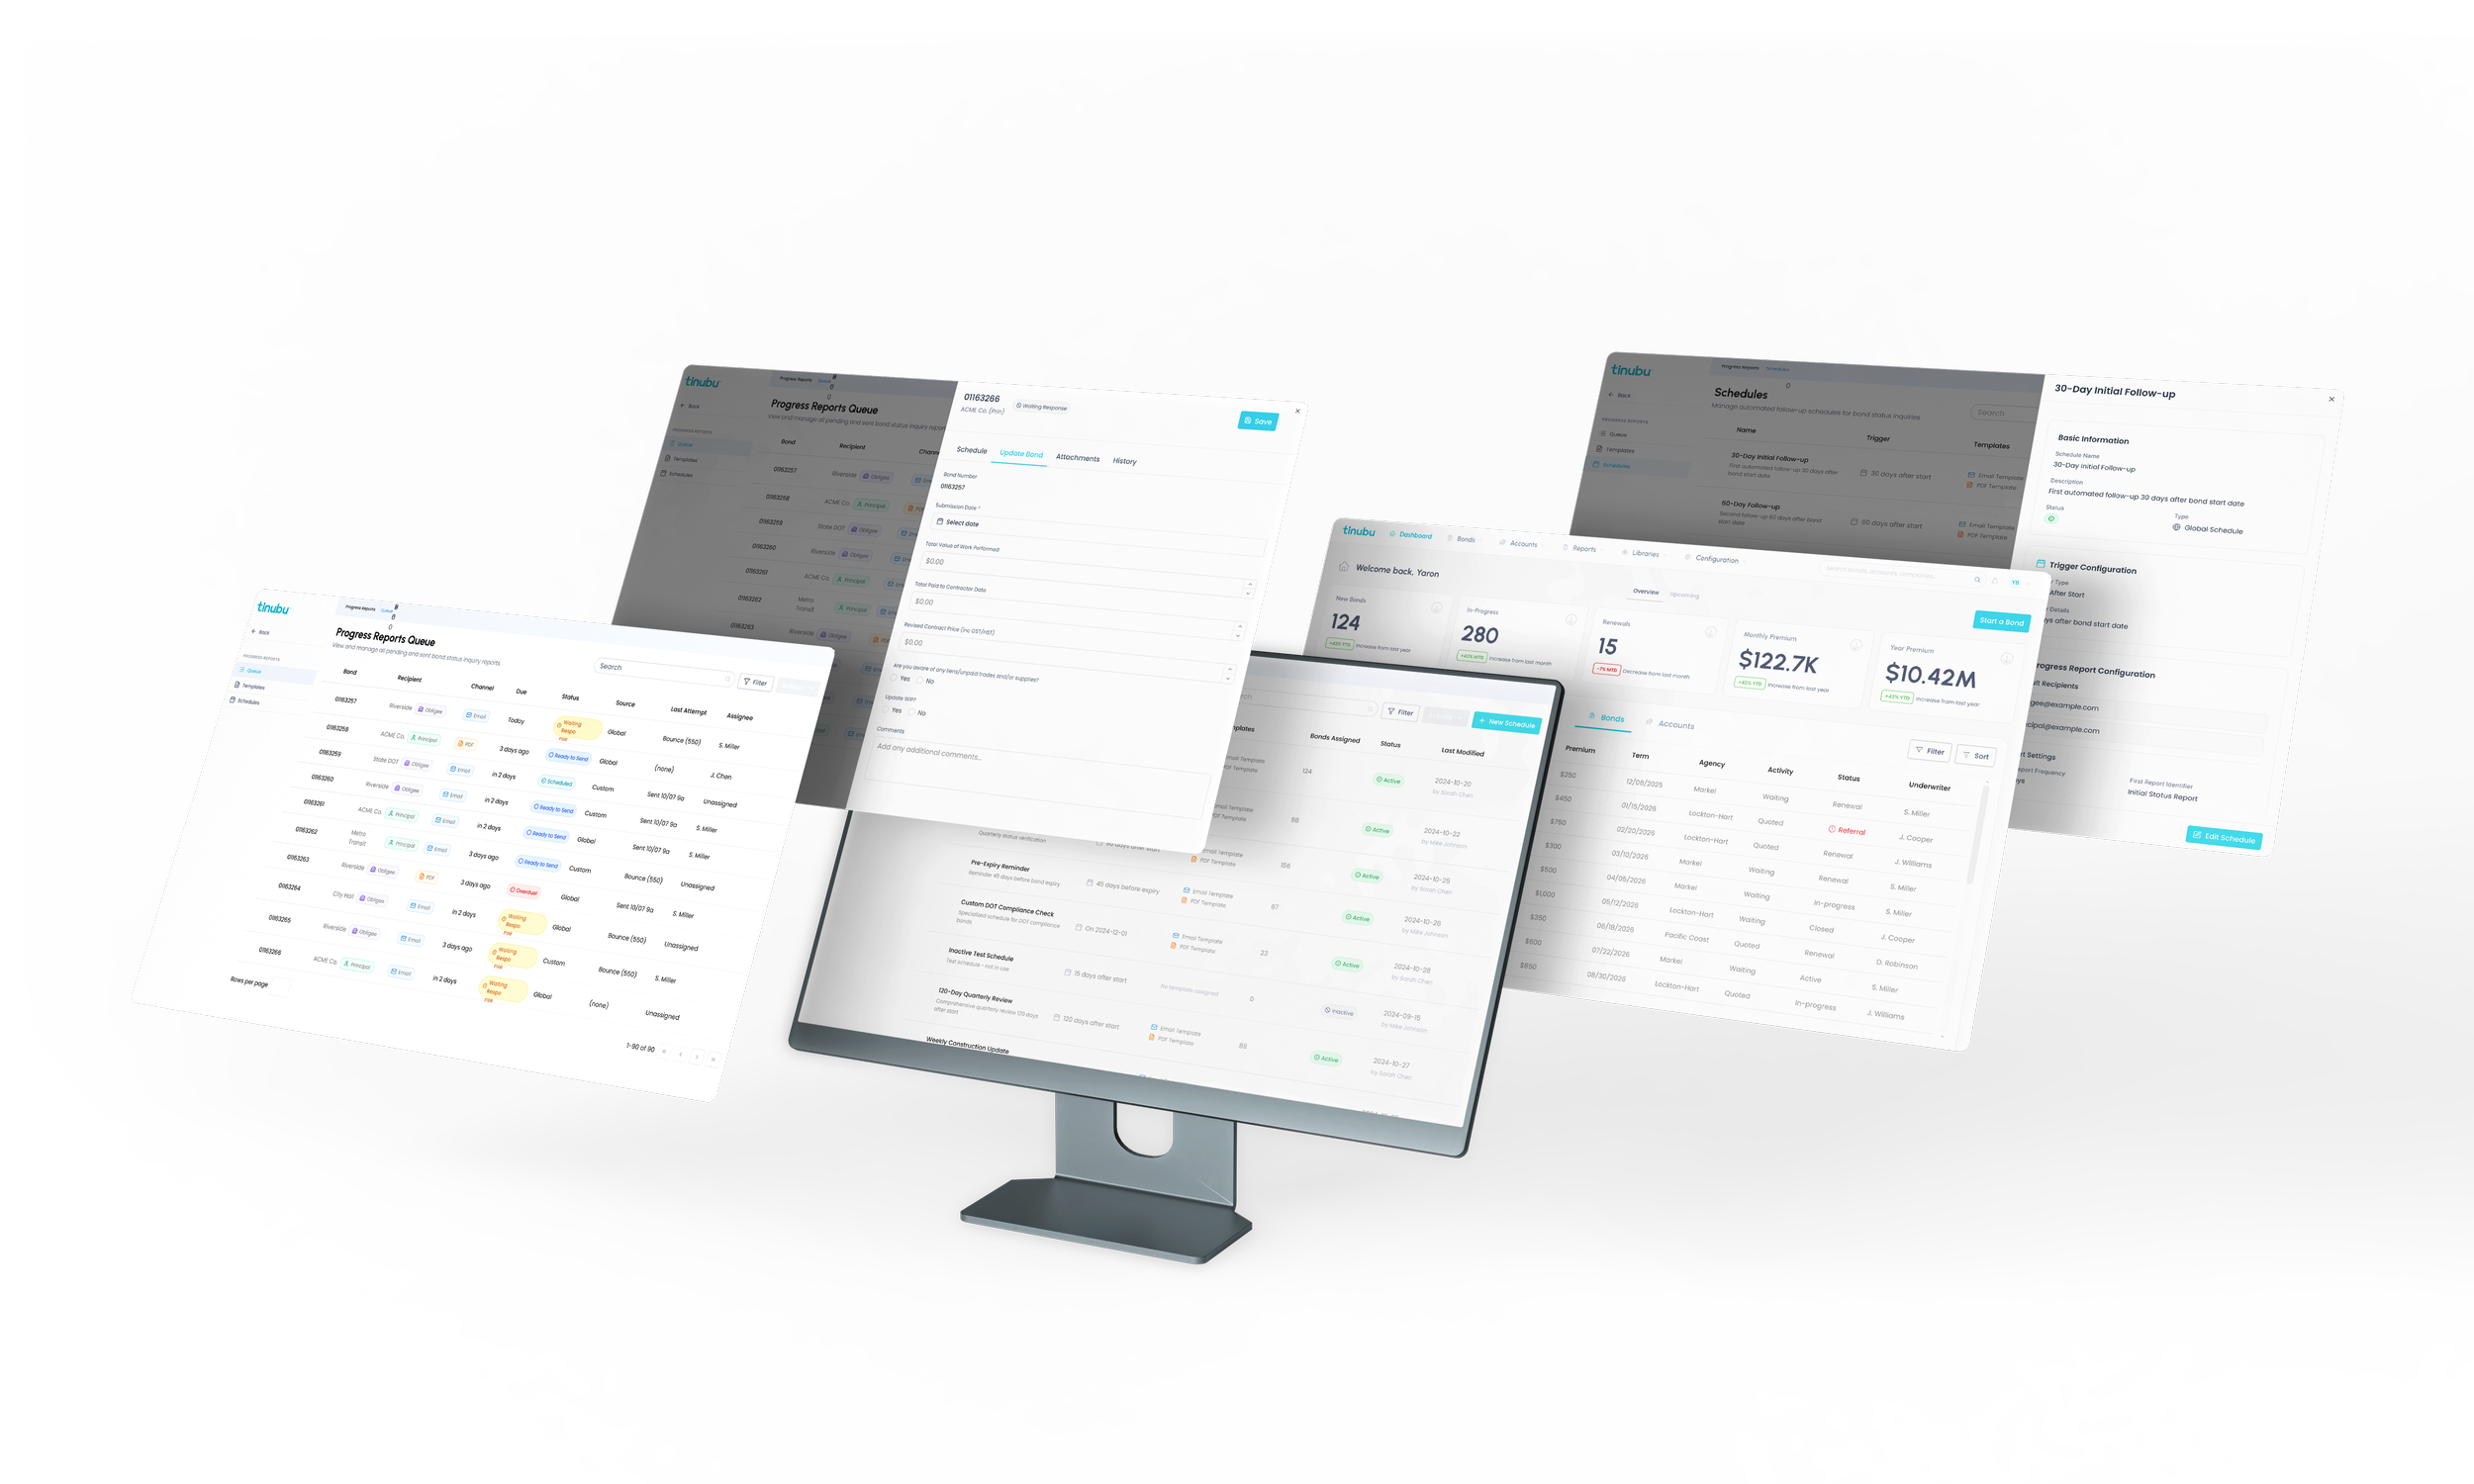
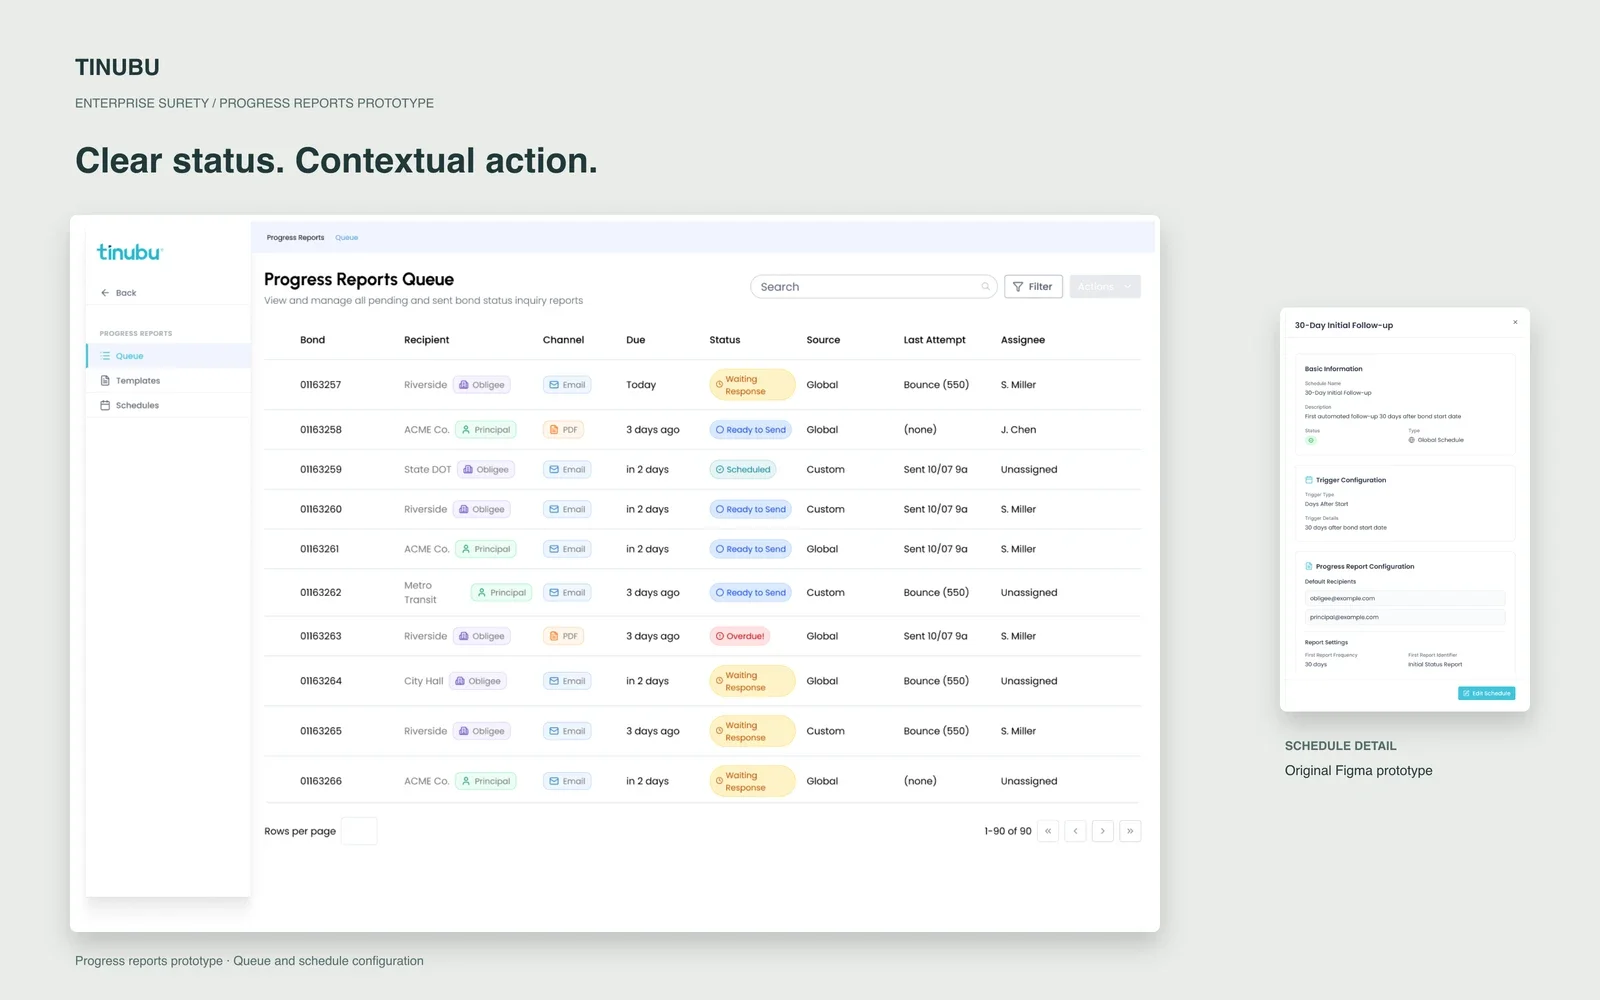
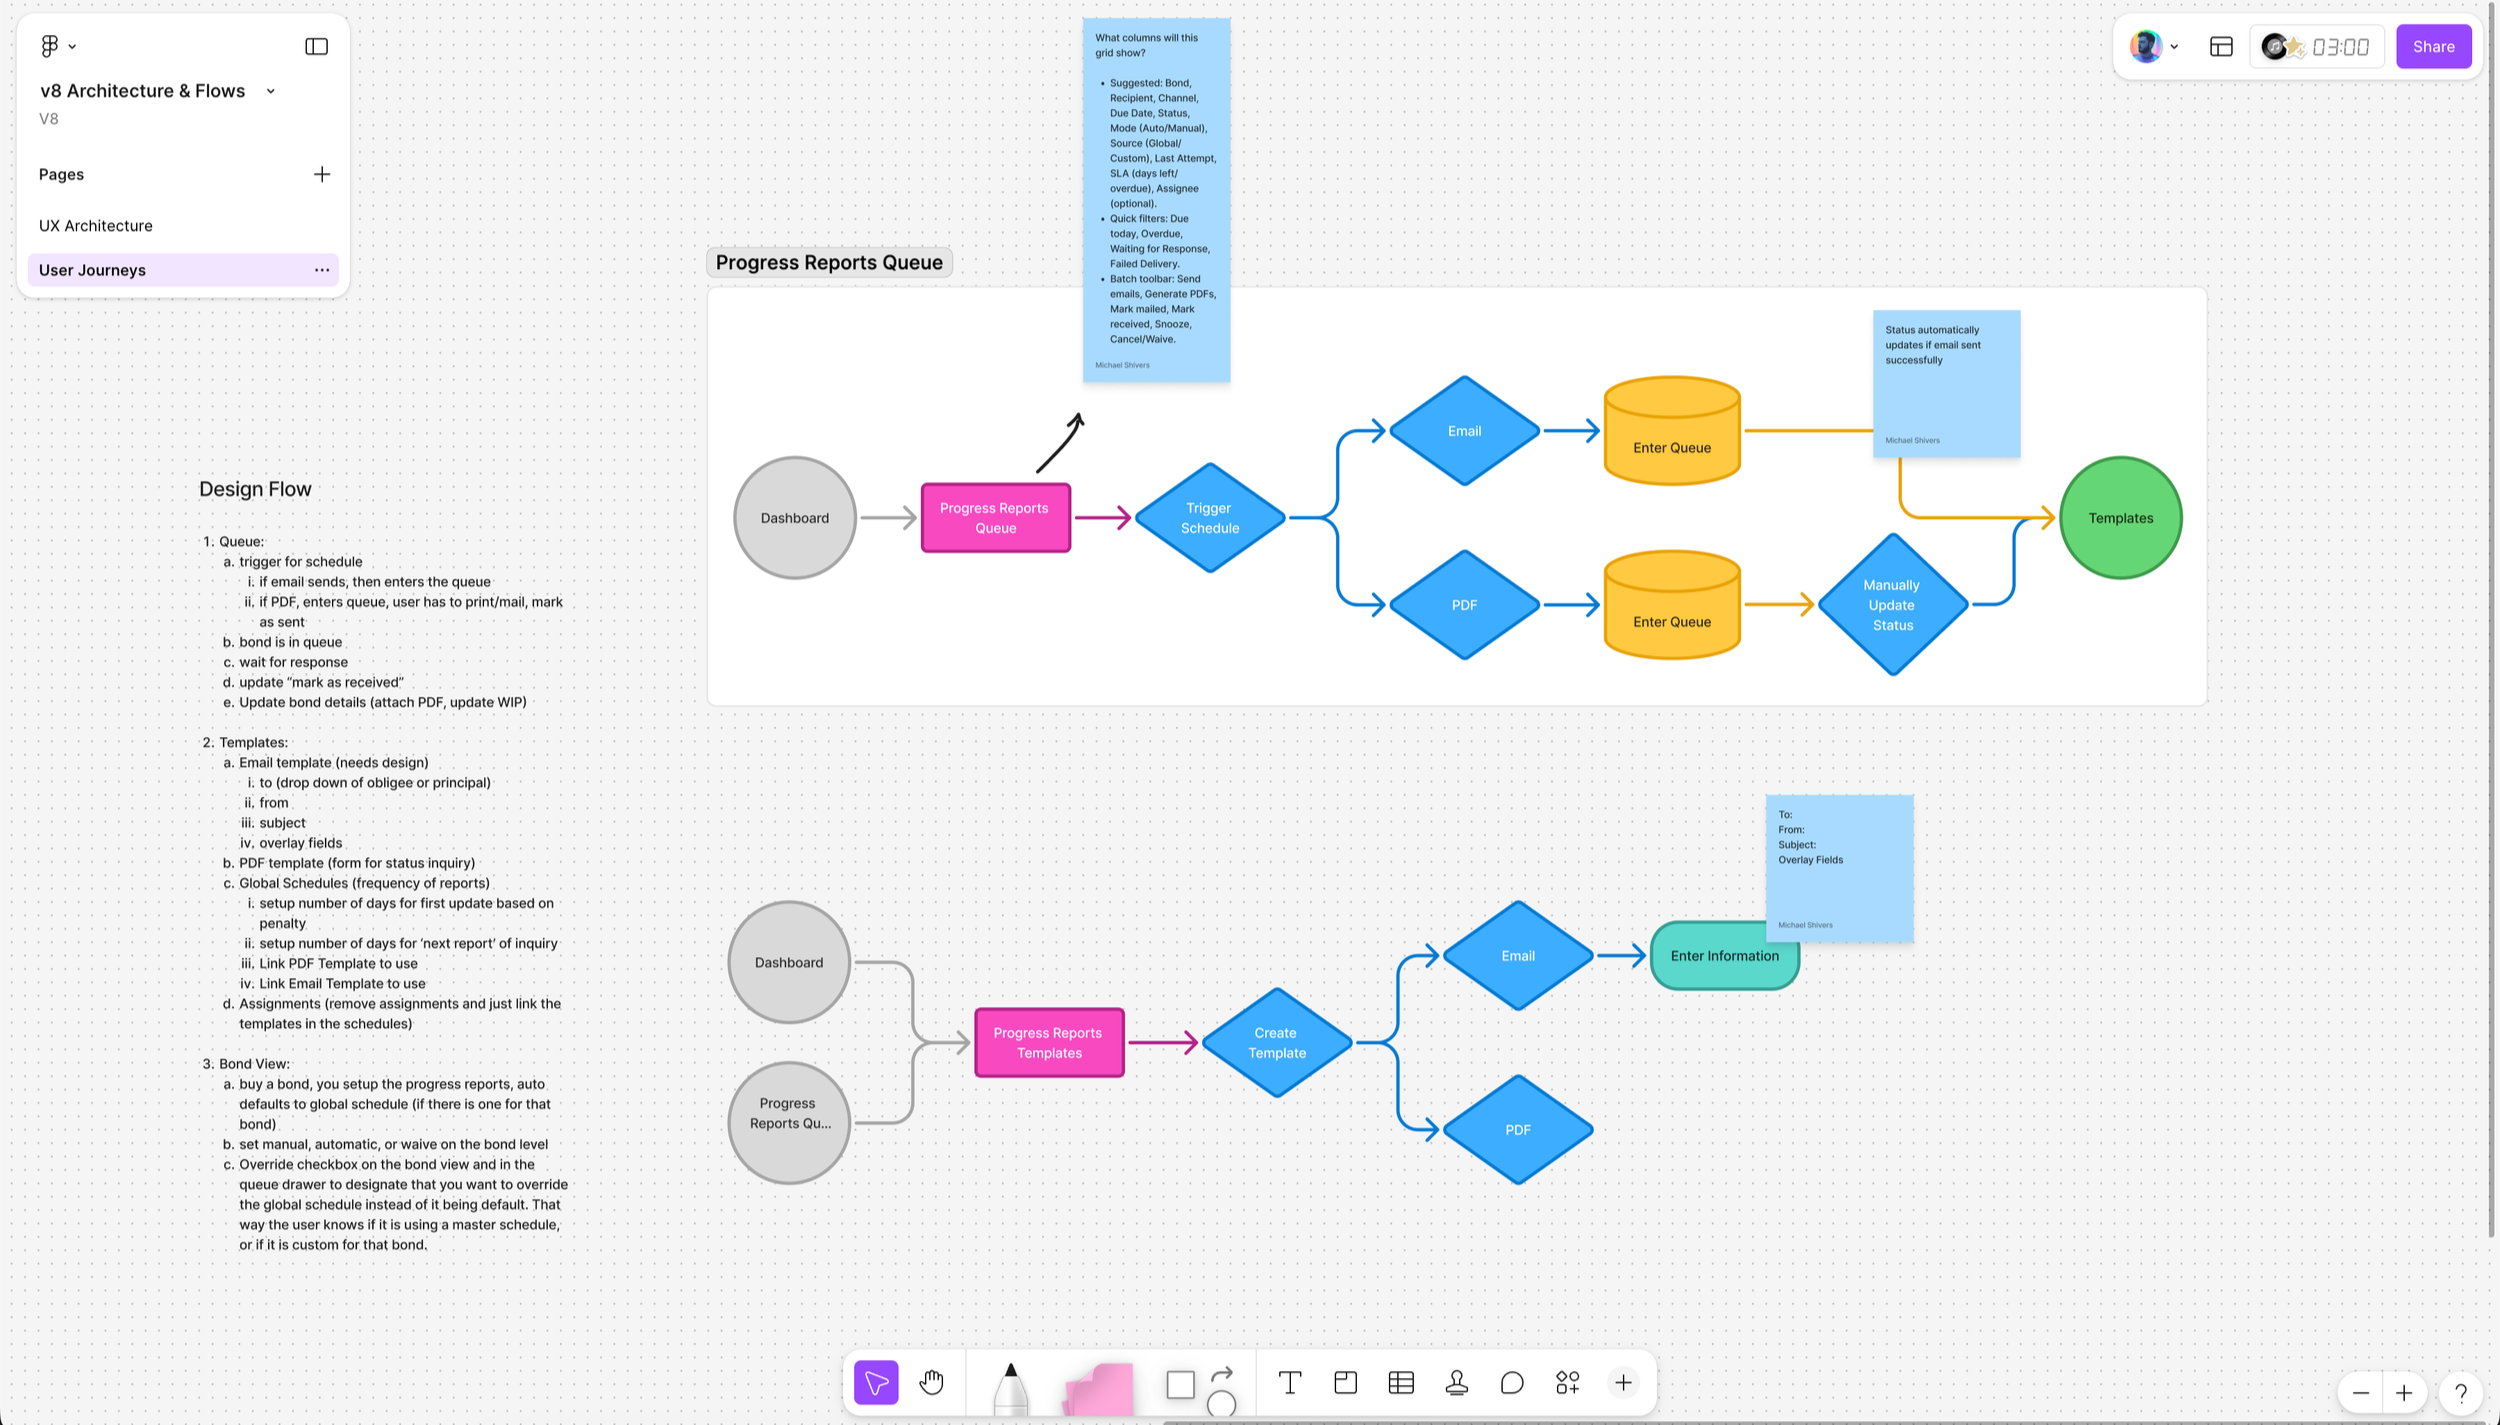
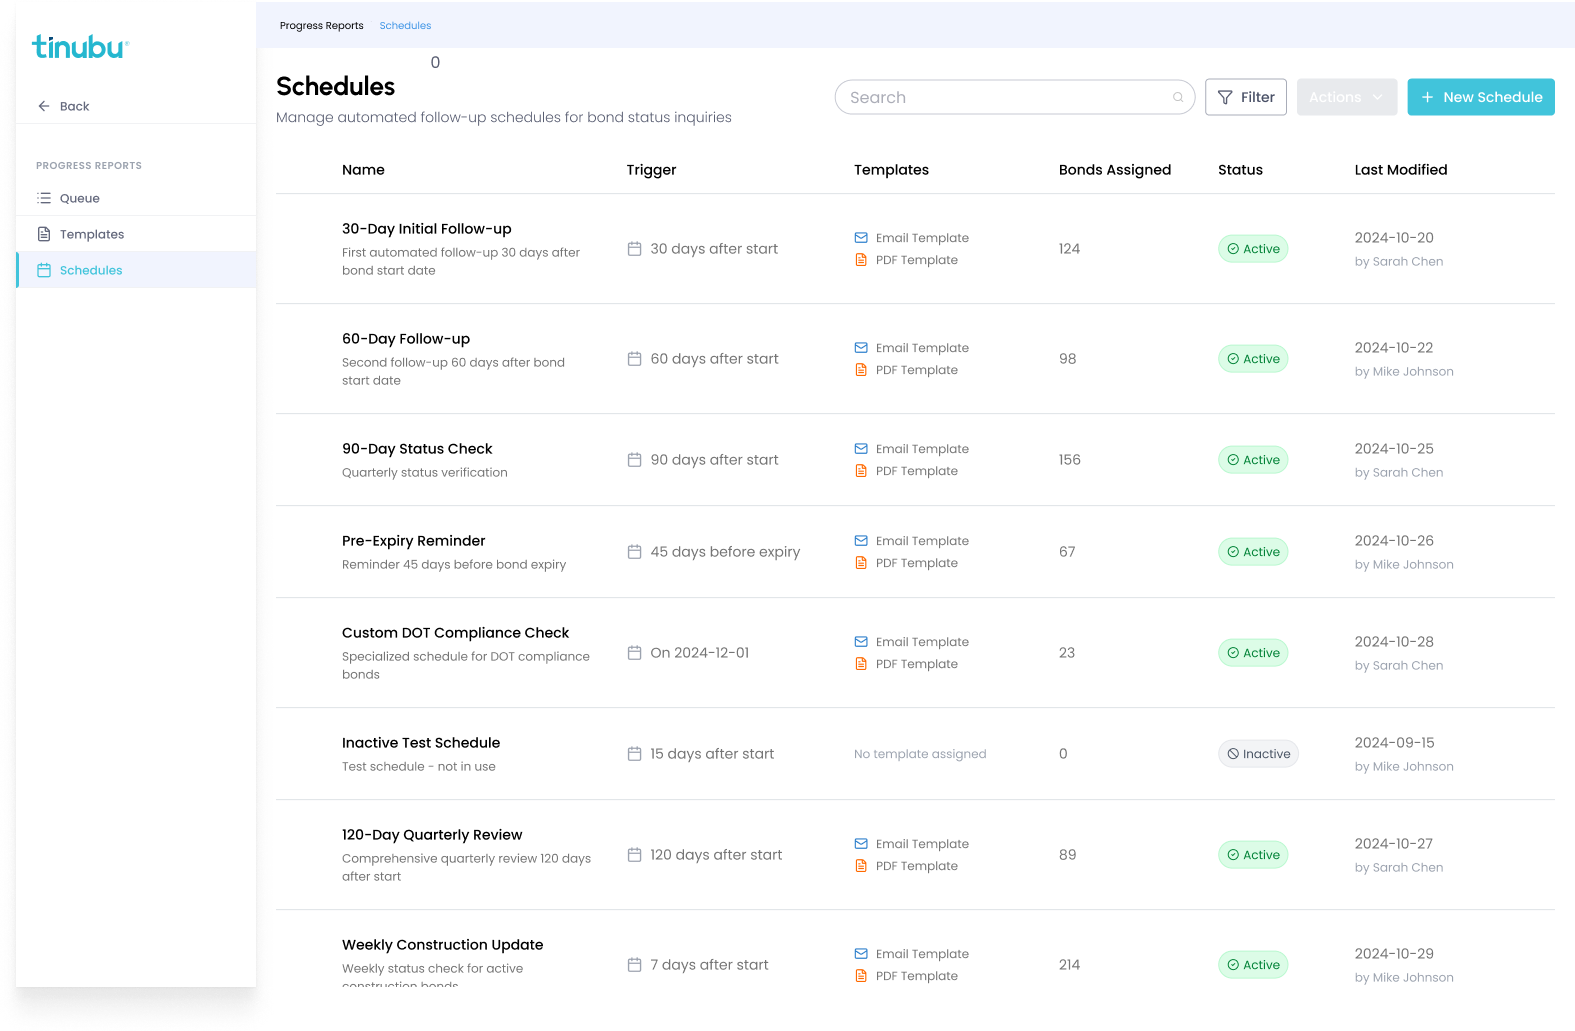
Progress Reports brings bond records and follow-up obligations into one workspace. The queue puts recipient, delivery channel, due date, status, source, last attempt, and assignee beside the record.
Text labels distinguish reports awaiting a response from those ready to send, scheduled, or overdue. That information structure makes the relationship between status and the next action visible in the design.
Connect overview and focused work.
Operational context stays in the row.
Due dates, delivery context, assignees, and explicit status labels sit together. Color supports the labels rather than carrying the meaning alone.
Configuration follows the rule structure.
Schedule configuration groups basic information, trigger settings, and reporting settings. Contextual panels retain the relationship to the list behind them.
A system carries across workflows.
Navigation, tables, forms, and action placement repeat across the available views. These patterns support the broader surety experience rather than treating each screen as an isolated layout.
A system grounded in the work.
My contribution included interaction-system development, design-team practices, prototyping, and direct support for React development. Contrast and visual readability were part of the interface work.
Make the next step clear.
Have a product or workflow that needs attention?
Discuss a project ↗ · Next case study →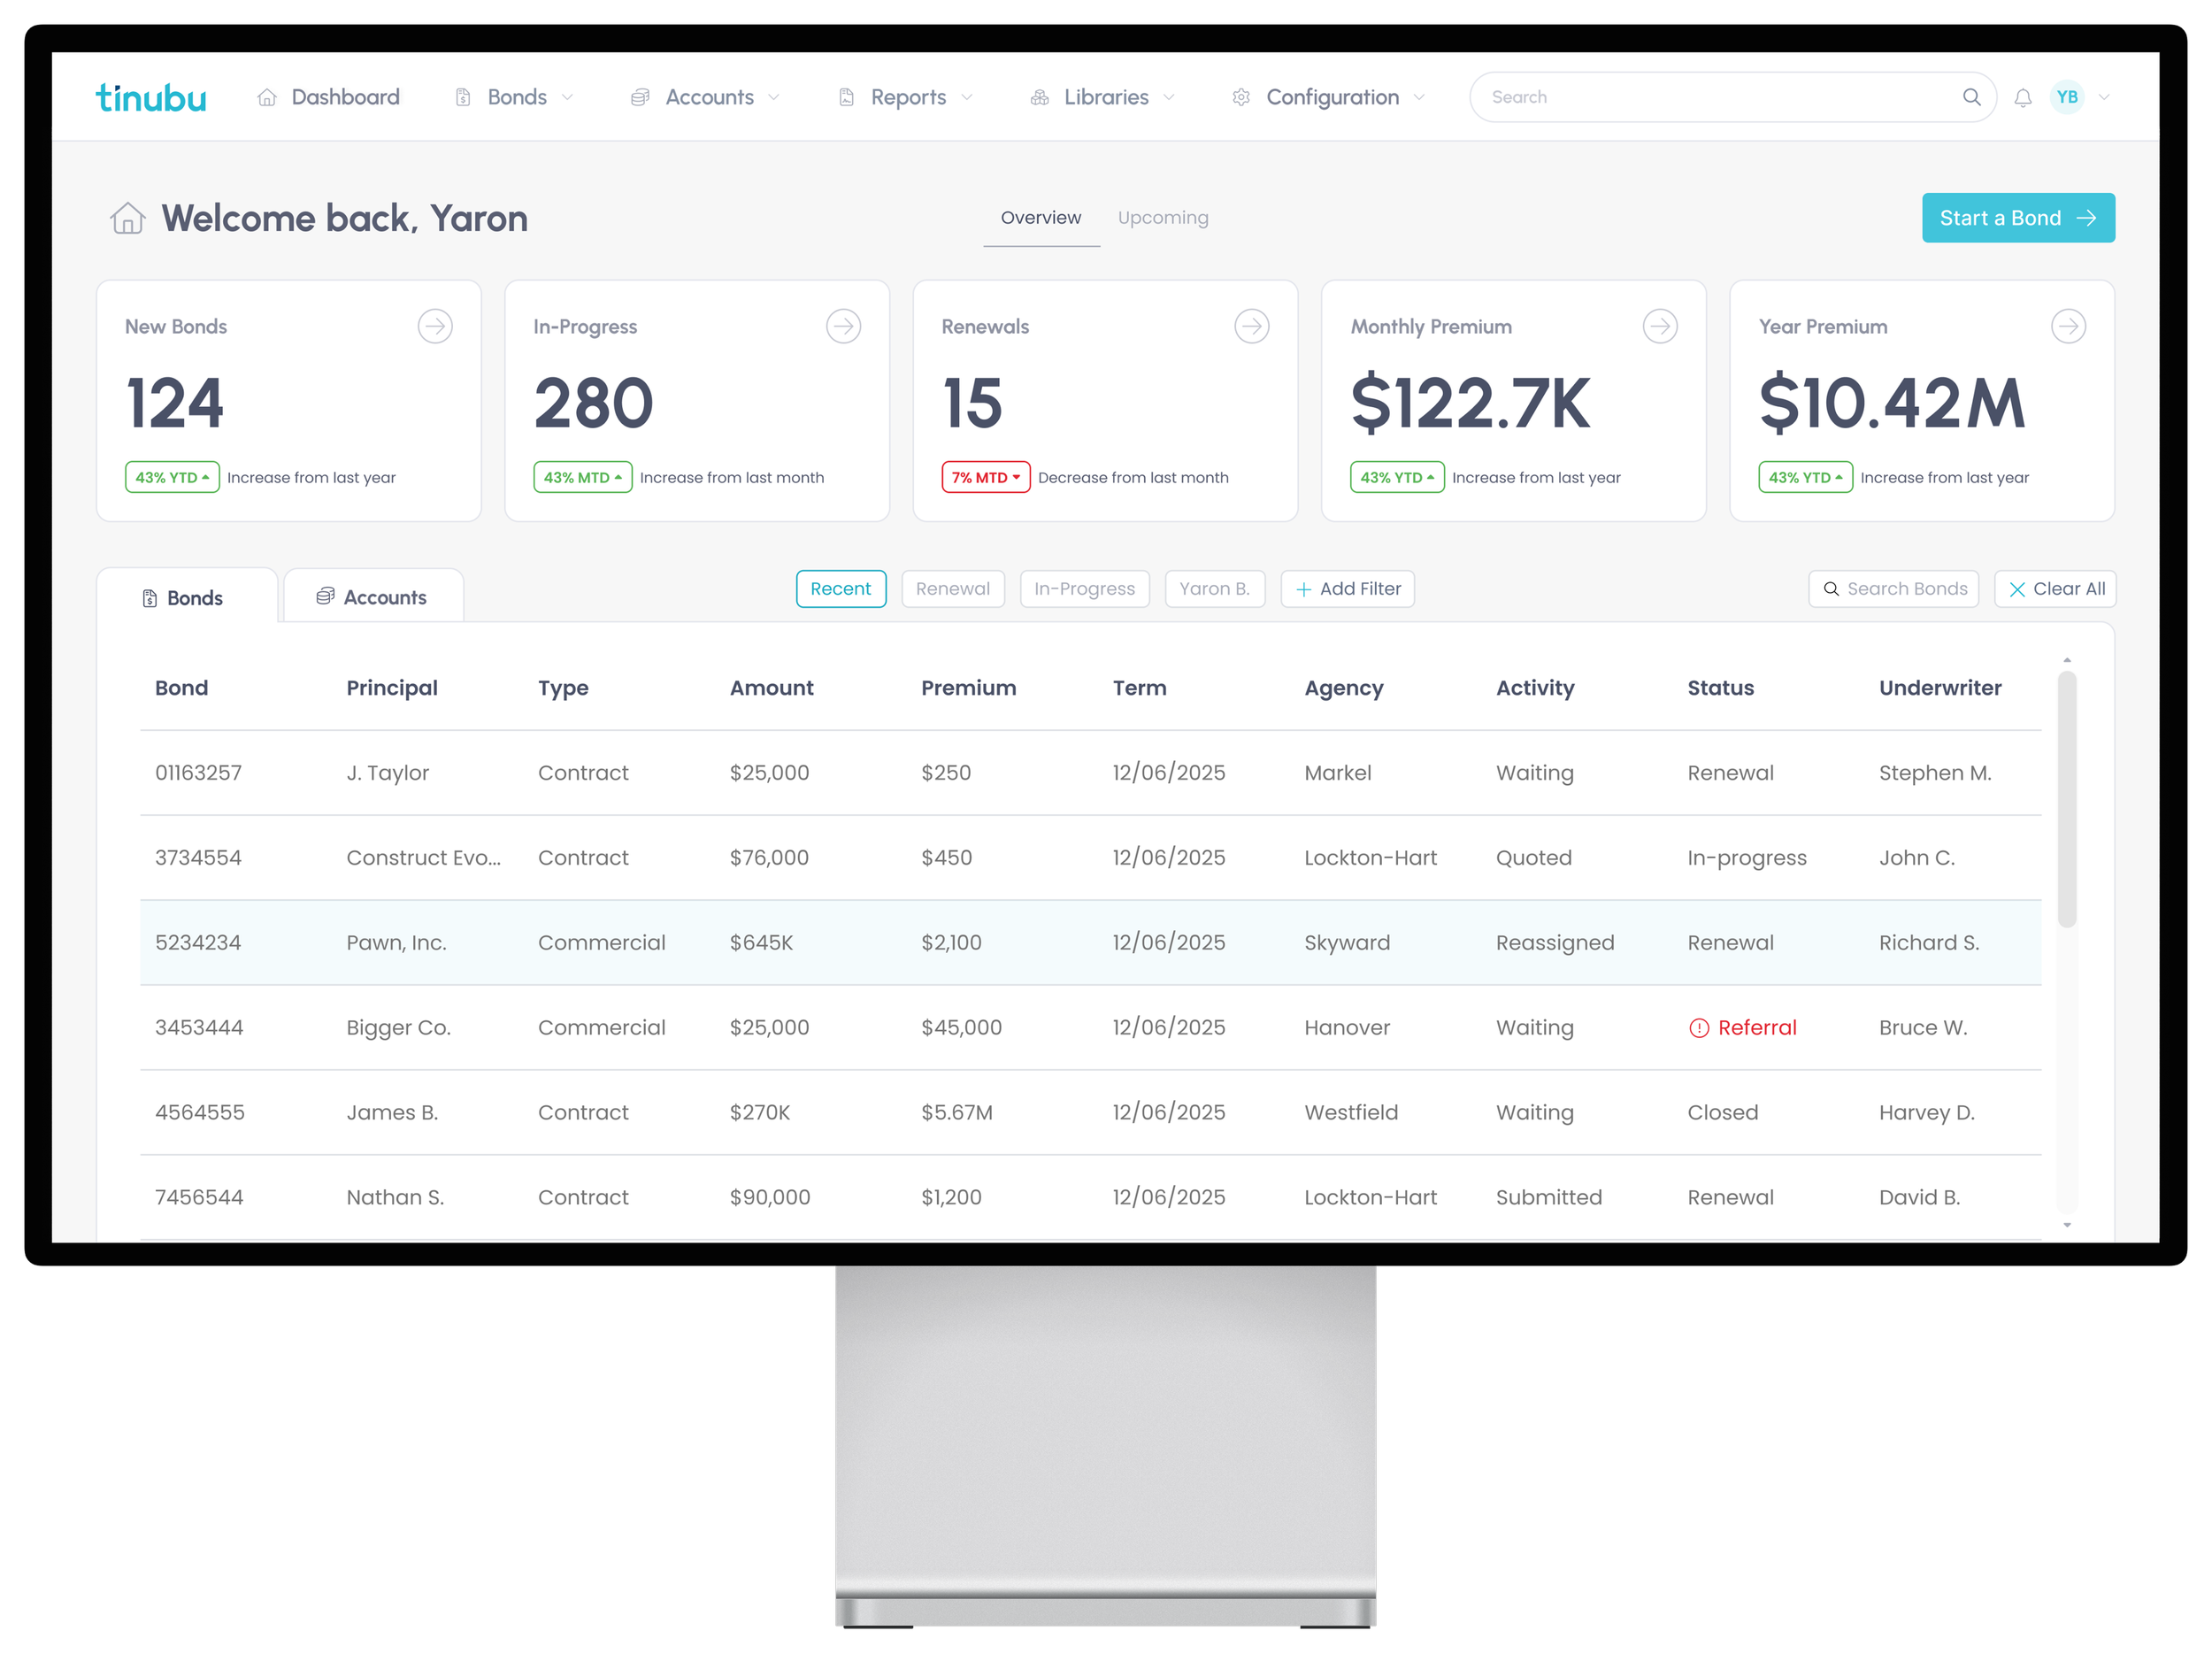
Making complex surety workflows easier to use
Tinubu Surety
Enterprise SaaS · Interaction systems · Design leadership
Brokers and underwriters needed to navigate complex bond information, complete forms, and move work through approvals. Inconsistent interactions and fragmented workflows made those tasks harder to learn and repeat. My work focused on a coherent system for the tasks people used every day.
I worked across navigation, forms, approvals, and complex data tables to make the platform easier to understand. The challenge was to support detailed surety workflows while giving users a clear path to the next action.
The design system connected those workflows through reusable interaction patterns. It gave product and engineering a shared foundation for improving existing products and developing the new SaaS experience.
My contribution
Design leadership
Interaction systems and UX architecture
Research and iterative prototyping
React development support
Visual accessibility
Platforms
Web
As Lead Product Designer at Tinubu, I led the design team, established design practices, and developed a scalable design system for enterprise surety products. I partnered with product, engineering, and stakeholders to improve existing platforms and shape a new SaaS experience.
My systems work went beyond components and tokens: I developed navigation, forms, approval workflows, and complex data-table patterns that supported brokers and underwriters across their daily tasks.
I created interactive prototypes with Figma Make and provided direct support for React development to connect design intent with implementation. I also designed for people with visual impairments, addressing contrast and visual readability across product interfaces.


The problem and design priorities
The legacy platform combined complex domain requirements with inconsistent navigation, cumbersome forms, and dense information. Brokers and underwriters needed to understand bond status and act without repeatedly relearning the interface.
I organized the redesign around three priorities: make common tasks easier to find, make information easier to scan, and create consistent patterns for entering data and progressing through approvals. The system needed to support expert workflows while remaining understandable to new users.
How I understood the work
User interviews: Conversations with brokers, underwriters, and internal teams grounded the design in the work people needed to complete.
Usability testing: Task walkthroughs exposed confusing navigation and friction in the legacy workflows.
Competitive analysis: Reviewing related products helped distinguish useful conventions from patterns that did not fit surety work.
Usage data: Platform activity helped prioritize common tasks alongside the qualitative research.


Legacy Dashboard
Modernized Dashboard (v2)
Design decisions and iteration
Navigation: An early sidebar brought features together but felt crowded in testing. I refined the structure around the tasks users needed most often.
Forms: A guided multi-step flow introduced friction for frequent users. The design evolved toward quick entry, useful defaults, and inline validation.
Data tables and dashboards: Dense underwriting information needed clearer hierarchy. I focused on scannable information and contextual access to detail rather than giving every data point equal prominence.
Approvals: Approval workflows became part of the interaction system alongside navigation, forms, and tables, supporting consistency across the surety experience.
Prototypes and implementation: Figma Make prototypes helped make interactions tangible. Direct React development support connected the proposed behavior with the build.
Visual accessibility: I addressed contrast and readability for people with visual impairments as part of the interface design.

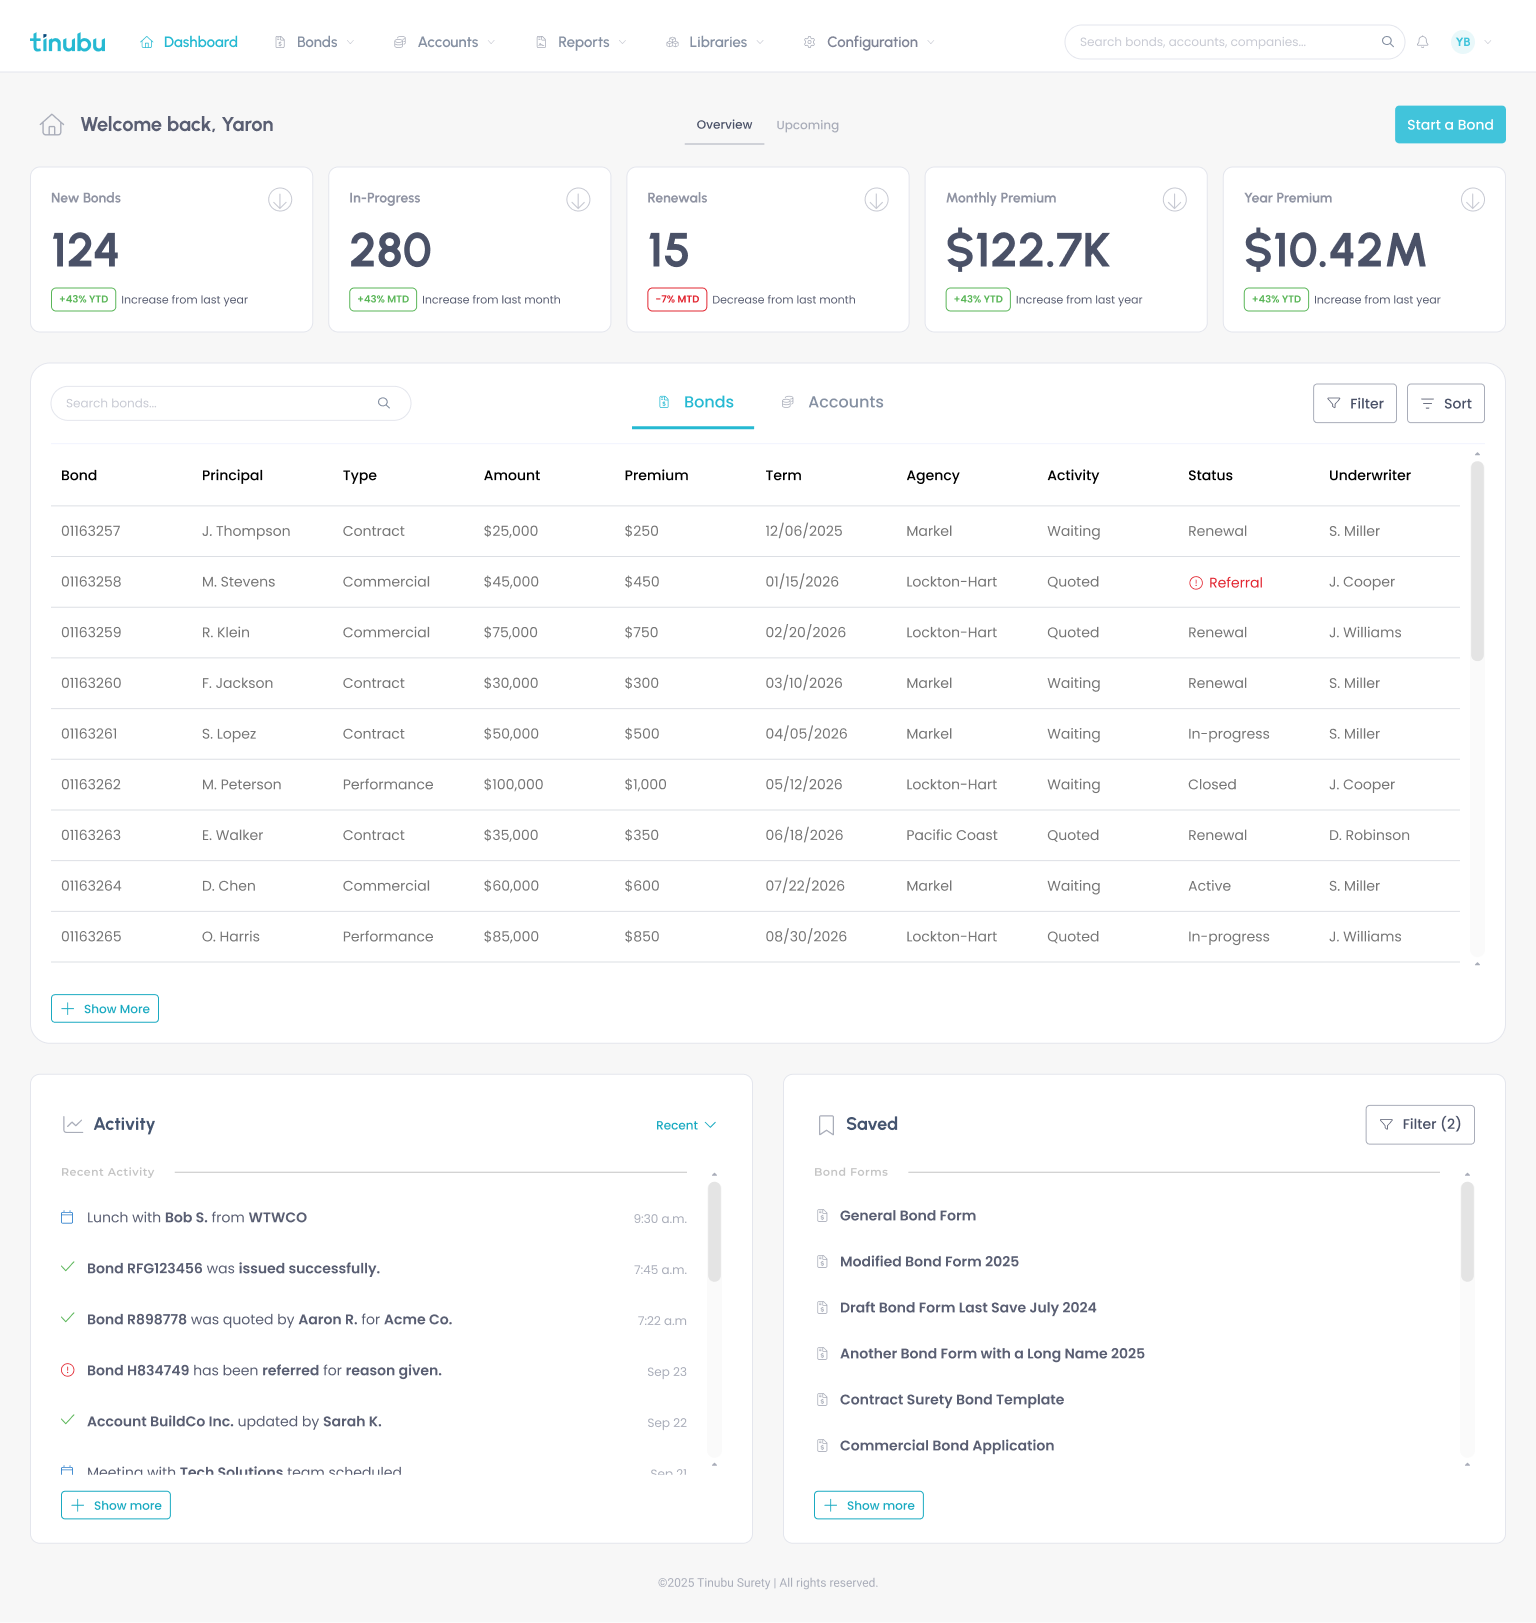
Modernized Dashboard (v3)
Design Outcome
The work connected navigation, forms, approvals, and data tables into a reusable interaction system for complex surety tasks.
Clearer task structure: navigation organized around the work brokers and underwriters needed to complete.
Consistent workflow patterns: forms and approvals designed as part of the same product experience.
Readable data: refined hierarchy for dense underwriting information and contextual detail.
Implementation support: Figma Make prototypes and direct React development support carried design decisions closer to the build.
Visual accessibility: contrast and readability addressed for people with visual impairments.
The dashboard examples document the evolution of the design and the system decisions behind it.
What this work demonstrates
A scalable system has to describe how people complete work, as well as how the interface looks. Navigation, forms, approvals, and data tables needed to work together as a coherent surety experience.
My contribution combined team leadership with hands-on interaction design, prototyping, and engineering support. Testing changed the proposed navigation, forms, and information hierarchy; those decisions shaped the system rather than being isolated screen refinements.